Interpreting sonar, down imaging and side imaging is very difficult. I have 3 great images to use as examples for teaching interpretation of sonar.
The left side imaging is showing the drop-off as dark (yellow arrows point to the drop-off on the map and side image). Bright is the strongest return and black is none. Since sound goes in a straight line the drop-off is dark.
The red circle is showing fish on the shallow side and I think they are about where the red arrow is pointing on the map. I would mark a waypoint on the side image and cast to the fish since they are shallow. Notice the boat is in 2.9 feet.

The next image shows the drop-off as dark (red circle) and fish are suspended near the drop (yellow arrow). Fish show up well on side imaging since they show up as bright on the dark background. Hard bottom is also bright which makes fish difficult to see on bright background.

This is an amazingly clear image of boulders (green arrow) next to trees (yellow arrow) that slid from the bank into the river.
The red arrow shows a fish in the trees and the white arrow shows a small drop-off.

I was out casting for shallow walleyes today and my ONIX side imaging was amazing.
I was in 2.8 feet of water and took this screenshot. Notice the range of 119 on each side and the screen is loaded with fish.
The fish are in the green circles and some rock in the black circle.
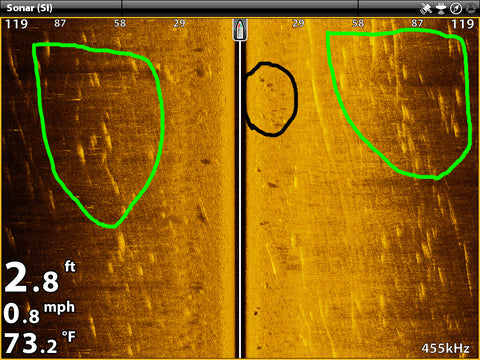
I was able to identify some of the fish since we caught sheephead and catfish plus I saw a school of carp swim by and a 5 foot sturgeon also swam by. No walleyes but we had an amazing experience.

I often get questions on what fish look like on side scan at different speeds from both Humminbird and Lowrance users.

Read More >>
Content on Humminbird, Vexilar, Lowrance mapping, Spotlight Scan and more coming soon.