Understanding Bottom with Sonar On April 18, 2020
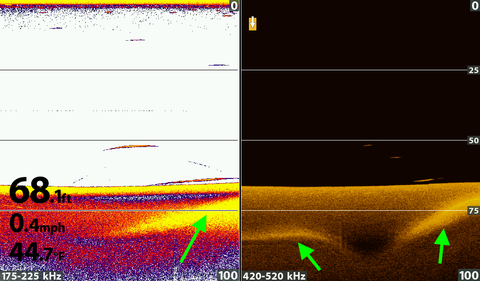
Always remember, your transducer is only showing the time it takes a signal to return and the strength of sonar return signals show the differing bottom hardness. This palette uses yellow to show the strongest sonar returns, so harder bottoms show as yellow, then red and a soft bottom, blue.
The green arrows point to what appears to be a hard layer beneath a soft bottom. Sonar does not penetrate below the surface of the bottom. The reason the yellow is below the red is because it is showing a harder area on the edge of the cone, which takes longer for the sound to return because it is farther from the transducer than at the center of the cone.
Sonar shows how far the target is from the transducer therefore the edge of the cone is farther from the transducer.
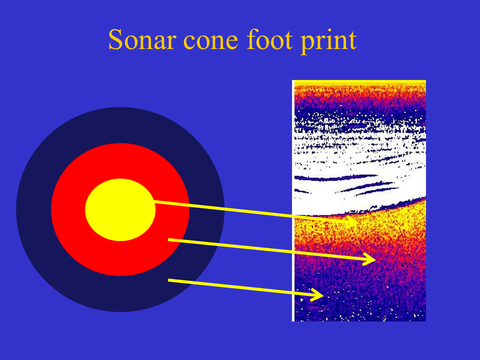
You will notice the sonar “bottom” usually has the strongest return first then the next strongest after that. The diagram shows the layering of the colors. The center of the cone has the strongest signal and it weakens at the edge of the cone. Since it is weaker at the edge of the cone the returning signal at the edge of the cone is weaker and farther away so what you see is what the below diagram shows.
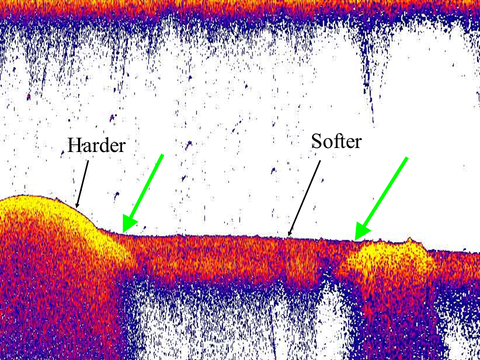
This example shows a fish over soft bottom but near hard bottom.
The green arrows point to harder bottom on the edge of the cone.